


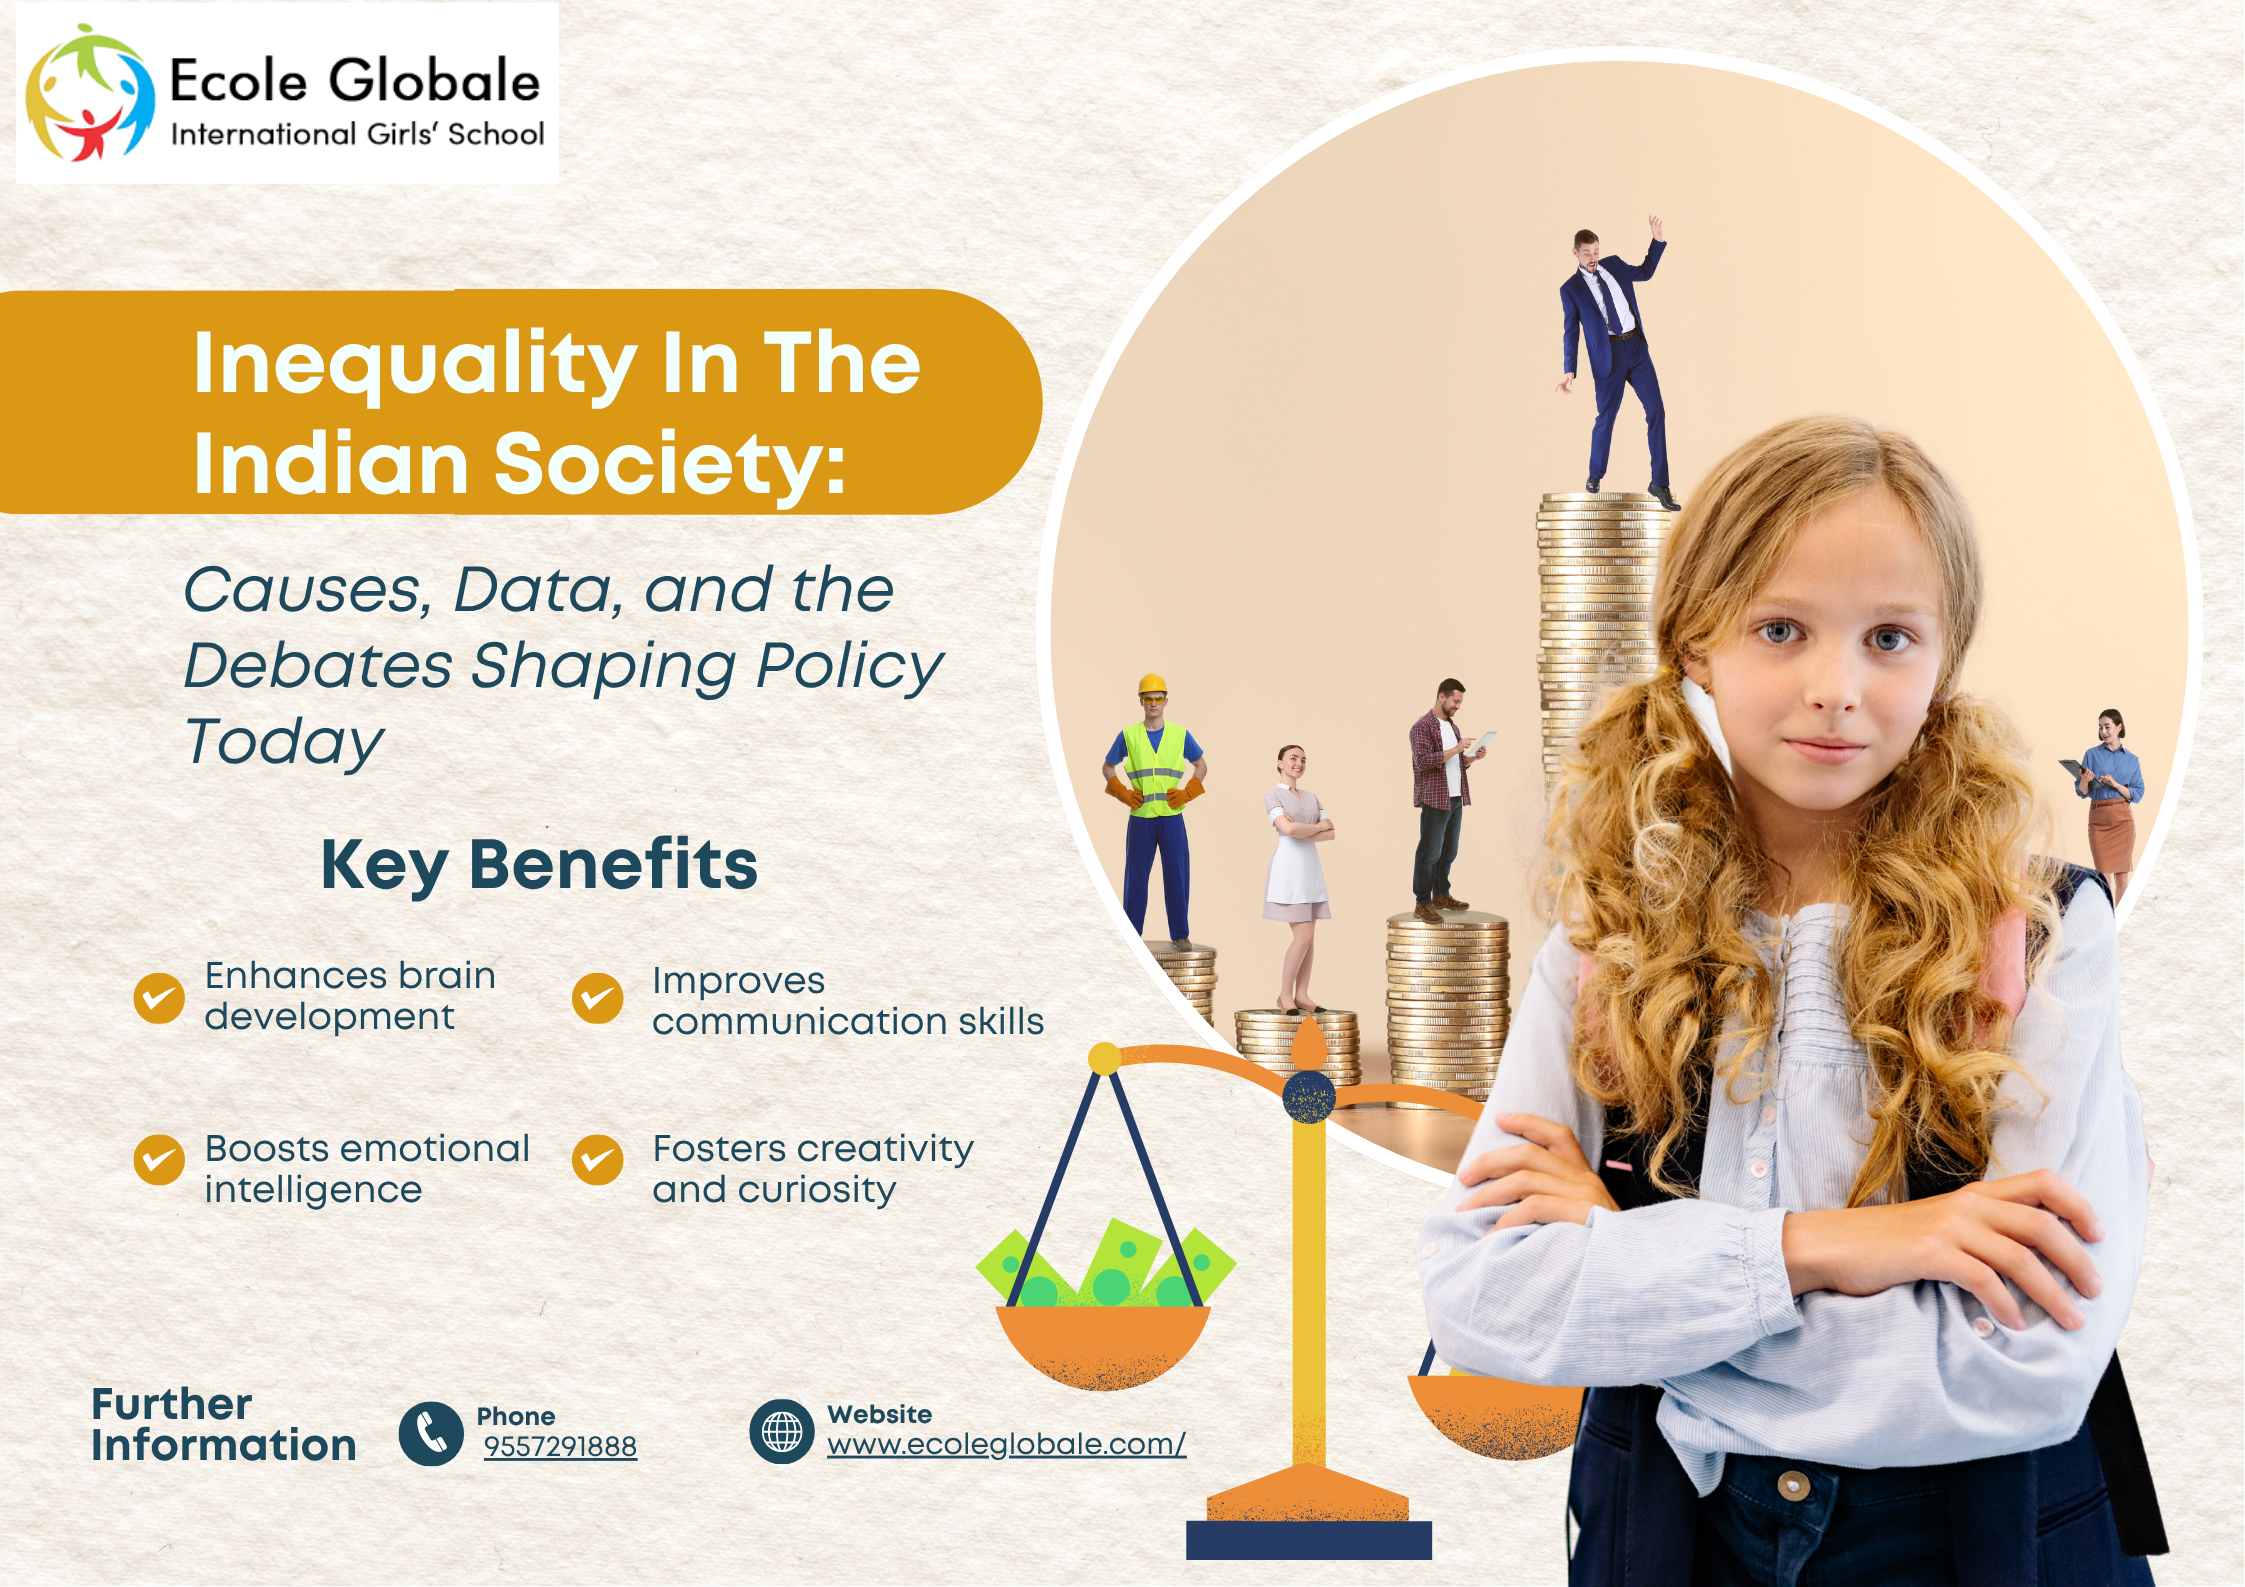
Inequality In The Indian Society isn’t one problem — it’s several overlapping ones that don’t always move in the same direction at the same time. India’s income inequality, measured by the Gini coefficient, is actually relatively low by global standards (25.5, per World Bank data), while its wealth inequality is among the highest in the world, with the richest 1% holding over 40% of national wealth. Layered on top of that economic picture are caste-based social hierarchies rooted in centuries of history, a gender gap that puts India 131st out of 148 countries on the WEF’s Global Gender Gap Report, and sharp regional and rural-urban divides in access to education, healthcare, and infrastructure. This piece walks through each dimension with current data, explains what’s driving them, and lays out where policy responses — including the genuinely contested ones like caste-based reservation — currently stand.
The Many Faces of Inequality in India
1. Caste-Based Inequality
India’s caste system, though constitutionally outlawed as a basis for discrimination since 1950, continues to shape social and economic life. Historically, caste determined occupation, access to land and education, and social standing, with Scheduled Castes and Scheduled Tribes systematically excluded from mainstream economic and educational opportunities for generations. Reservation policies in education, public employment, and legislative bodies were designed to correct this, and have produced measurable gains — but caste continues to influence marriage patterns, informal social networks, and, in parts of the country, access to housing and employment, in ways that formal law doesn’t fully reach.
2. Economic and Wealth Inequality
This is where India’s inequality picture gets counterintuitive. On income distribution alone, India scores relatively well internationally. But wealth — accumulated assets, property, and capital — tells a very different story: the wealth Gini coefficient sits around 0.74, and Oxfam India estimates the richest 1% hold more than 40% of the country’s total wealth. The gap reflects how inherited wealth and asset ownership compound over generations in ways that annual income figures don’t capture. At the same time, extreme poverty has fallen substantially, down to roughly 2.3% by 2022-23, with an estimated 171 million people lifted out of extreme poverty between 2011 and 2023 — showing that poverty reduction and wealth-gap reduction are related but genuinely separate trends.
3. Gender Inequality
India ranks 108th of 193 countries on the UNDP’s Gender Inequality Index and 131st of 148 on the WEF’s Global Gender Gap Report — reflecting gaps in political representation (women hold roughly 14% of parliamentary seats), economic participation (women contribute under 20% of GDP), and safety, alongside a persistent literacy gap (male literacy around 84% versus female literacy around 72%). Encouragingly, some of the underlying trends are improving: female gross enrolment ratios at the elementary level now slightly exceed those for boys, though the gap widens again at the secondary and higher-education transition points, particularly in India’s most disadvantaged regions.
4. Regional and Rural-Urban Inequality
Development outcomes vary sharply by state and by rural-versus-urban geography. Southern and western states generally show stronger human development indicators, industrial investment, and per-capita income than several northern and eastern states, a gap that traces back to differences in historical infrastructure investment, industrialisation timing, and governance capacity. Within states, rural areas typically lag urban centres on healthcare access, digital connectivity, and quality school infrastructure, even where overall state-level indicators look reasonable on paper.
5. Educational Inequality
Access to quality education remains uneven along almost every axis discussed above — caste, gender, region, and economic class. Government schools, which serve the majority of India’s children, are frequently under-resourced relative to private schools, creating a widening gap in learning outcomes between children who can access private or elite institutions and those who cannot. This gap compounds over a lifetime, since early educational disadvantage shapes access to higher education, skilled employment, and, ultimately, the next generation’s starting point.
Inequality In The Indian Society in Numbers
| Indicator | Latest Figure |
| Income Gini Index (World Bank, 2022-23) | 25.5 — among the more equal in income distribution globally |
| Wealth Gini Index (Global Wealth Report) | ≈ 0.74 — among the most unequal in wealth concentration globally |
| Share of national wealth held by richest 1% | Over 40% (Oxfam India) |
| Extreme poverty rate (2022-23) | 2.3%, down from a much higher base — 171 million people moved out of extreme poverty between 2011 and 2023 |
| Gender Inequality Index rank (UNDP, 2022 data) | 108th of 193 countries |
| Global Gender Gap Report rank (WEF, 2025) | 131st of 148 countries |
| Male literacy rate | ≈ 84% |
| Female literacy rate | ≈ 72% |
| Women’s representation in Parliament | ≈ 14% |
Figures compiled from World Bank, UNDP Human Development Report, World Economic Forum, and Oxfam India data as of the most recent available reporting cycle (2025-26). Individual indicators are updated on different schedules; always check the primary source for the latest release.
What’s Being Done — and Where the Debate Stands
India’s constitutional and policy response to inequality operates on several tracks simultaneously:
- Constitutional safeguards: Articles 15, 16, and 17 prohibit discrimination on grounds of caste, religion, sex, and place of birth, and abolish untouchability outright.
- Reservation policy: Quotas in education, government employment, and legislatures for Scheduled Castes, Scheduled Tribes, and Other Backward Classes, later extended to Economically Weaker Sections. This remains one of India’s most actively debated policy areas — see the FAQ below for both sides.
- Direct benefit transfers and financial inclusion: Schemes like PM Jan Dhan Yojana, Direct Benefit Transfer, and Ayushman Bharat aim to close gaps in financial access and healthcare, and are widely credited with contributing to the recent fall in extreme poverty.
- Gender-targeted programmes: Beti Bachao Beti Padhao, Mahila Shakti Kendra, and related schemes target the sex ratio, girls’ education, and women’s economic participation specifically.
The reservation debate in particular remains genuinely contested rather than settled. Supporters point to decades of measurable gains in SC/ST/OBC representation in education and public employment as evidence the policy is working as designed. Critics — across a range of political positions — argue for recalibrating some quotas toward economic criteria, note that benefits haven’t always reached the most disadvantaged within reserved categories, and point to social friction the policy has generated among groups outside its scope. Indian courts and government commissions continue to revisit the policy’s design periodically, most recently around the question of extending economic criteria further; there’s no single settled answer on where this lands next.
Schedule a campus visit at Ecole Globale →
Learn more about student life →
Frequently Asked Questions
Q1. What is the main cause of inequality in Indian society?
Ans: There isn’t a single cause — inequality in India stems from overlapping factors: the historical caste hierarchy, uneven access to education and land, gender norms that restrict women’s economic participation, and regional disparities in infrastructure and industrialisation. Most sociologists treat these as compounding rather than competing explanations.
Q2. Is India’s income inequality high or low compared to other countries?
Ans: By the income Gini coefficient, India actually ranks among the more equal countries globally (25.5, per World Bank data), which surprises many people. But this measures income flow, not accumulated wealth — India’s wealth Gini is far higher (around 0.74), meaning assets and inherited wealth are much more concentrated than year-to-year income suggests.
Q3. How does caste-based inequality persist despite constitutional protections?
Ans: The Constitution abolished untouchability and mandated reservation in education, government jobs, and legislatures for Scheduled Castes, Scheduled Tribes, and Other Backward Classes. Legal equality hasn’t fully translated into social and economic equality, though — caste continues to shape marriage patterns, access to informal social networks, and, in some regions, discrimination in housing and employment, even where it’s not visible in formal policy.
Q4. Is the reservation system solving inequality or creating new problems?
Ans: This is genuinely contested. Supporters argue reservation is essential compensatory justice for centuries of systemic exclusion and point to measurable gains in SC/ST representation in education and government employment. Critics argue it should be re-calibrated toward economic criteria, has created new resentments among excluded groups, and hasn’t reached the most disadvantaged within reserved categories as effectively as intended. Government commissions and courts continue to revisit the policy’s scope and criteria.
Q5. Which is a bigger driver of inequality in India — caste or class?
Ans: Researchers increasingly treat this as a false binary: caste and class interact rather than operate separately. Historical caste position shaped access to land, education, and capital, which in turn shapes present-day economic class — so caste and class disadvantage tend to overlap heavily rather than being independent variables.
Q6. How has India’s poverty rate changed in recent years?
Ans: Extreme poverty fell sharply, from a much larger share of the population to roughly 2.3% by 2022-23, with an estimated 171 million people moving out of extreme poverty between 2011 and 2023 — driven partly by direct benefit transfer schemes, expanded financial inclusion, and rural welfare programmes. Poverty reduction and inequality reduction are related but distinct trends, though: poverty can fall while the gap between the richest and everyone else still widens.