



The human brain processes images 60,000 times faster than text.
That single statistic — from research published by 3M Corporation and widely validated by subsequent neuroscience studies — contains within it the entire argument for the power of visual learning.
We are, at our core, visual creatures. Approximately 90% of all information transmitted to the brain is visual. The visual cortex — the brain region dedicated to processing what we see — is the largest single cortical area in the human brain, consuming more neural real estate than any other sensory system.
And yet, for most of the history of formal education, schools have taught primarily through words: text on blackboards, lectures, printed textbooks, written examinations. The gap between how the human brain naturally processes information and how schools have traditionally delivered it is large — and consequential.
Visual learning bridges that gap. It is not a trend or a teaching fad. It is an alignment between instructional design and the fundamental architecture of human cognition.
This article explains the neuroscience behind visual learning’s power, the specific strategies that make it effective, the important nuances the research reveals, and how the best schools in India are harnessing it to transform student outcomes.
What Is Visual Learning?
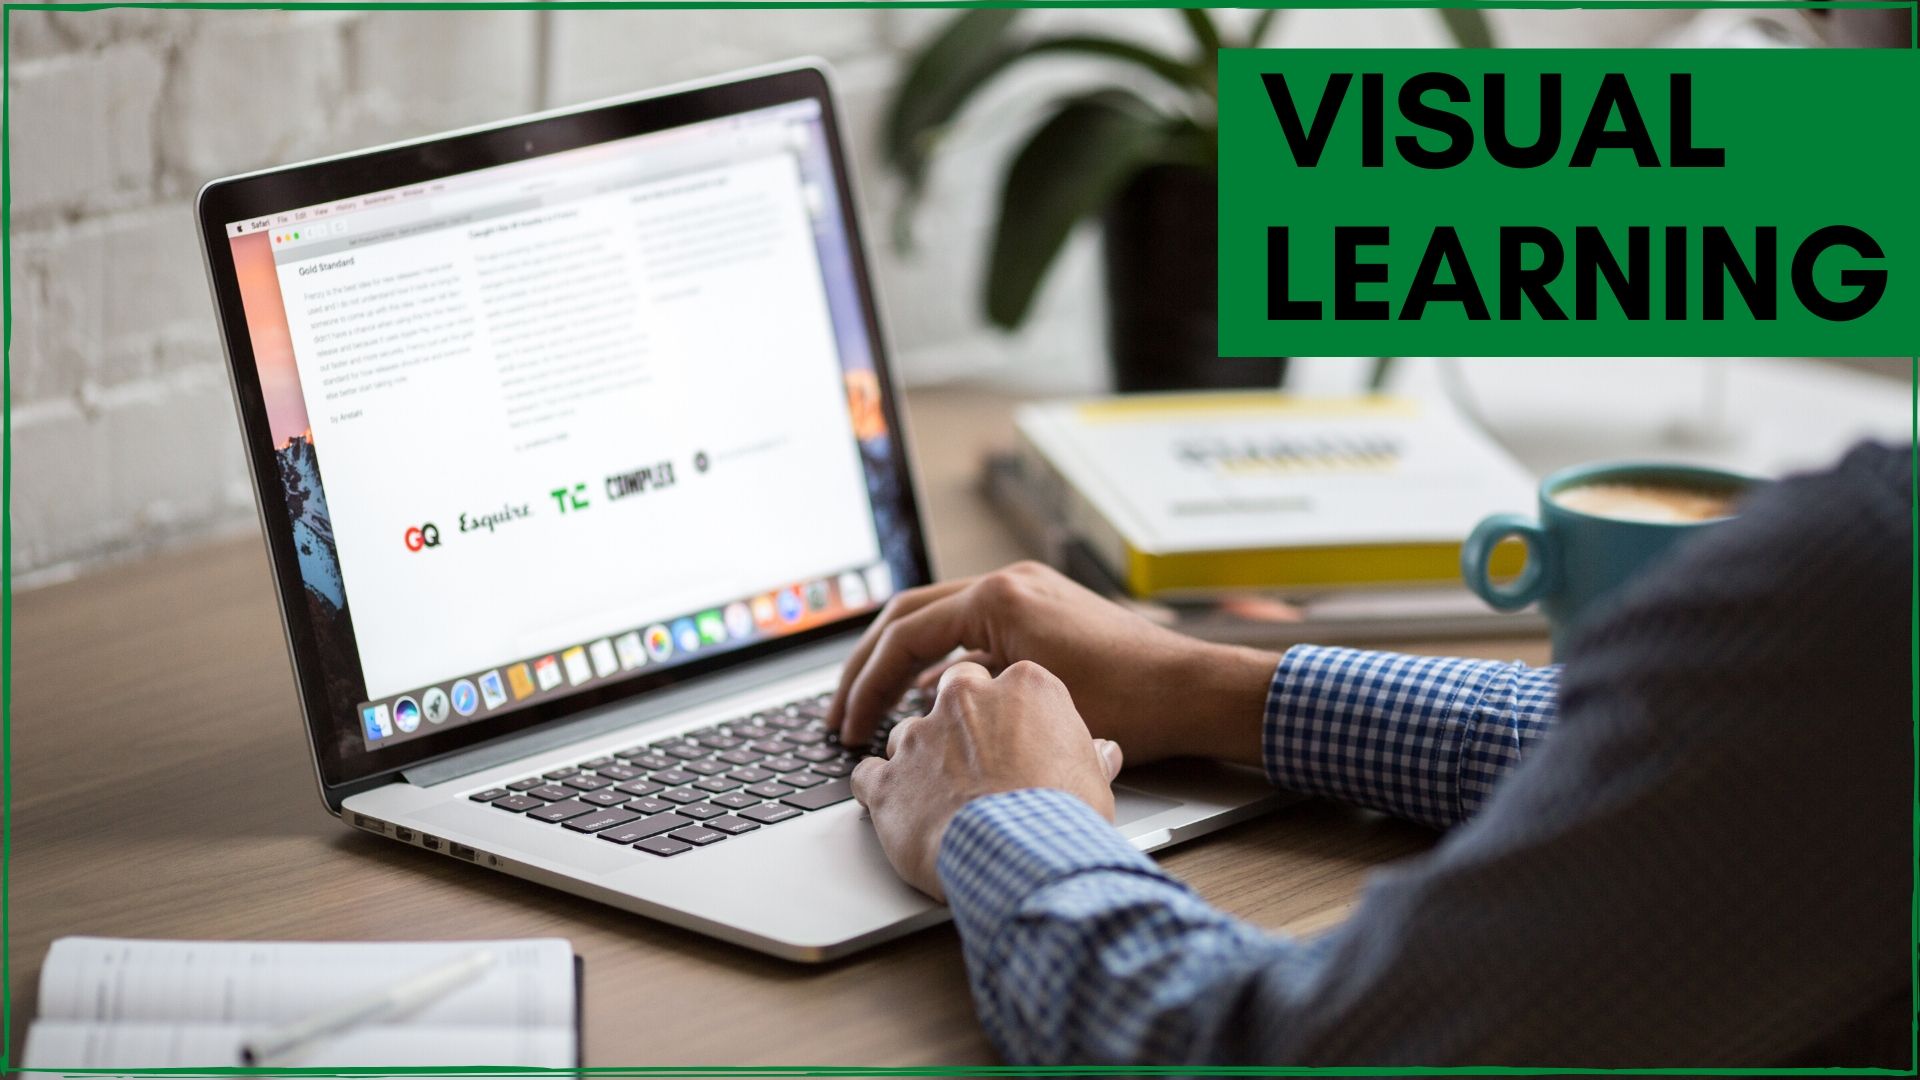
Visual learning is an approach to education that uses visual elements — images, diagrams, charts, videos, infographics, mind maps, graphic organisers, and spatial representations — as primary vehicles for delivering, organising, and retaining information.
It is distinct from simply “showing pictures.” Genuine visual learning leverages the brain’s visual processing system to make abstract concepts concrete, complex relationships clear, and information more memorable — by encoding it in a format the brain is optimised to receive.
Visual learning is relevant to all students — not just those who self-identify as “visual learners.” The research on this distinction is important and often misunderstood, and we address it directly below.
The Neuroscience: Why Visual Information Is So Powerful

Understanding why visual learning works requires a brief look at how the brain actually processes information.
The Visual Cortex Dominates
The human visual cortex occupies roughly 30% of the cerebral cortex — compared to 8% for touch and just 3% for hearing. This is not an accident of evolution. Vision has been the primary sense through which humans navigate, survive, and make decisions for hundreds of thousands of years.
When information is presented visually, it activates this dominant processing system directly — triggering faster recognition, stronger emotional engagement, and more efficient memory encoding than text-based information can achieve.
Dual Coding Theory
One of the most important frameworks in educational neuroscience is Dual Coding Theory, developed by cognitive psychologist Allan Paivio. His research demonstrated that information presented both verbally AND visually is processed through two separate cognitive channels — creating two independent memory traces rather than one.
The result: dual-coded information (text + image, or spoken word + diagram) is significantly easier to recall than information presented in a single format alone. Students who encounter a concept explained both verbally and visually are more likely to understand it, retain it, and be able to apply it later.
This is why the best visual learning does not replace text — it partners with it.
The Picture Superiority Effect
The Picture Superiority Effect is one of the most replicated findings in memory research. Studies consistently show that people remember approximately:
- 10% of what they read (text only)
- 20% of what they hear (audio only)
- 65–80% of what they see combined with what they hear (visual + verbal)
A study by researchers at the University of Rochester found that visual information is processed in as little as 13 milliseconds — far faster than any other form of information. Images bypass the brain’s filtering systems and land directly in long-term memory in ways that text simply cannot replicate.
Working Memory and Cognitive Load
Working memory — the brain’s “desktop” where active thinking happens — has a limited capacity. When students try to process dense text, much of that working memory is consumed simply by the act of decoding language. When the same information is presented visually, the cognitive load of decoding is reduced, freeing working memory for actual understanding and higher-order thinking.
This is why a well-designed infographic can communicate in seconds what a paragraph takes minutes to convey — and why students taught through visual strategies consistently demonstrate better comprehension of complex material.
An Important Nuance: Visual Learning vs. “Visual Learner” Myths

Before going further, it is important to address a widespread misconception.
The popular idea that students are categorically “visual learners,” “auditory learners,” or “kinaesthetic learners” — and that teachers should teach each student exclusively in their preferred style — has been largely debunked by research.
A 2018 study published in Anatomical Sciences Education, involving over 400 students, found that matching teaching style to learning style preference did not improve outcomes. Similar findings have been replicated across dozens of studies.
But this does not mean visual learning is ineffective. It means the opposite.
The research shows that visual learning strategies benefit all students — not just those who prefer visual input. The mistake was in treating visual learning as a personality type. The reality is that visual techniques leverage universal features of human cognition — dual coding, the picture superiority effect, reduced cognitive load — that apply to every brain, not just self-identified “visual learners.”
The practical implication for schools: do not design instruction to match perceived learning styles. Design instruction to use the full range of modalities — especially visual — because all students benefit from visual representation of information, regardless of their stated preference.
8 Proven Visual Learning Strategies That Work in the Classroom

1. Graphic Organisers
Graphic organisers — Venn diagrams, concept maps, flow charts, KWL charts, T-charts — structure information spatially, making relationships between ideas visible. A review of research published in Review of Educational Research found that graphic organisers consistently improve reading comprehension, retention, and higher-order thinking across subjects and age groups.
For students encountering complex topics — cause and effect in history, relationships between biological systems, narrative structure in literature — a well-designed graphic organiser makes the architecture of the content visible and navigable.
2. Mind Mapping
Mind mapping — pioneered by Tony Buzan and now one of the most widely used visual learning tools globally — organises information radially around a central concept, with branches for related ideas. It mirrors the brain’s associative structure and is particularly powerful for brainstorming, planning essays, revising for examinations, and making connections across topics.
Students who use mind maps for revision consistently report higher confidence in their material and perform better in examinations that require synthesis and application of knowledge.
3. Educational Video and Animation
Video engages multiple cognitive channels simultaneously — visual, auditory, and narrative — creating richer encoding than any single channel alone. A 2016 study published in Learning and Instruction found that students who learned through short, well-designed educational videos outperformed text-only learners on both immediate recall and long-term retention.
Critically, video is particularly powerful for explaining processes — chemical reactions, historical events, mathematical operations — where the sequence and causality of steps is important. Animation makes invisible processes (molecular reactions, geological formations, cellular division) visible and comprehensible in ways no textbook diagram can.
4. Infographics and Data Visualisation
Infographics combine data, text, and visual hierarchy to communicate complex information clearly and memorably. In an era of information overload, the ability to present and interpret information visually is both a learning tool and a critical 21st-century skill.
Teaching students to create infographics — not just consume them — develops visual literacy, analytical thinking, and communication skills simultaneously.
5. Virtual Reality (VR) and Augmented Reality (AR)
The most immersive frontier of visual learning. VR places students inside the content — walking through ancient Rome, observing molecular structures from within, conducting simulated medical procedures. AR overlays information onto the real world — scanning a diagram to see it come to life in three dimensions.
Research on VR in education consistently shows dramatic improvements in student engagement, comprehension of spatial and abstract concepts, and long-term retention compared to conventional instruction. A 2019 meta-analysis found that VR-based learning produced effect sizes of 0.5–0.8 on learning outcomes — among the highest of any educational intervention studied.
6. Diagrams, Charts, and Visual Note-Taking
The act of creating visual representations — not just consuming them — is itself a powerful learning strategy. Students who sketch diagrams while reading, create charts from data, or draw concept maps while listening to a lecture process information more deeply than passive recipients of visual content.
This is sometimes called “sketchnoting” — a hybrid of note-taking and visual representation that combines words, drawings, and spatial organisation to create highly personalised, deeply encoded learning materials.
7. Colour Coding and Visual Hierarchy
The strategic use of colour in learning materials is not aesthetic — it is cognitive. Colour coding helps the brain categorise and organise information, reducing cognitive load and making patterns visible. Students who colour-code their notes, revision materials, and mind maps consistently report improved recall and organisation of material.
Visual hierarchy — the use of size, weight, position, and colour to signal the relative importance of information — helps students identify and prioritise key concepts in dense material.
8. Timelines and Sequence Charts
For content with a temporal or sequential structure — historical events, scientific processes, narrative development, mathematical problem-solving sequences — timelines and sequence charts make the order and relationship of events visually explicit. Students who organise historical knowledge on timelines, for example, demonstrate significantly stronger comprehension of cause and effect than those who learn from linear text alone.
Visual Learning in the 21st Century Classroom
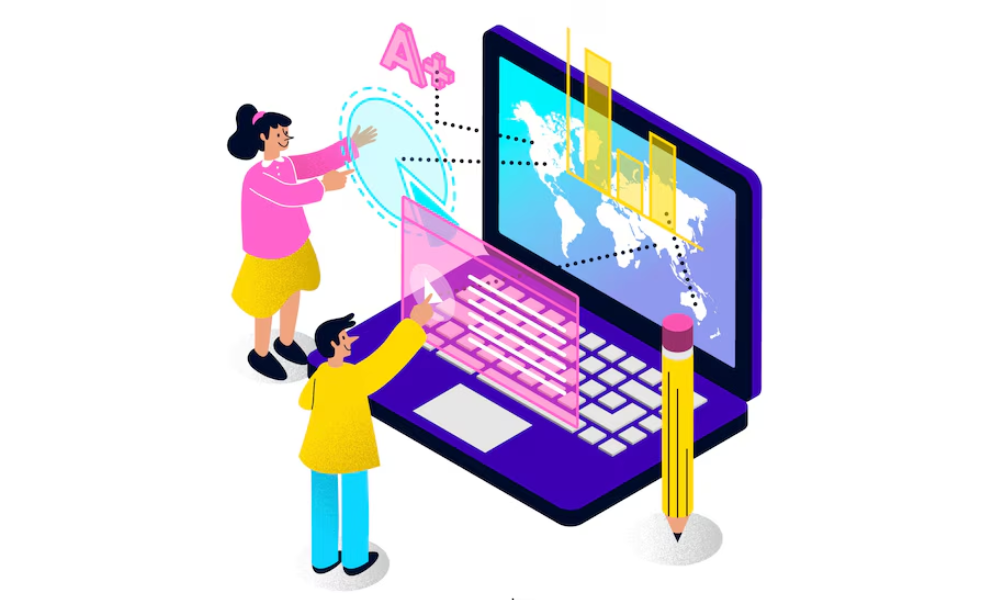
The digital revolution has transformed what visual learning can achieve in schools. Tools that were once available only to the most resourced institutions are now accessible to any school with commitment and vision.
Interactive Whiteboards replace static blackboards with dynamic, multimedia-rich learning environments where teachers can switch between diagrams, videos, live annotations, and interactive exercises in real time.
Learning Management Systems (LMS) enable students to access visual materials — videos, infographics, animated explanations — on demand, reviewing and rewatching as needed to achieve understanding.
AR-Enhanced Textbooks allow students to scan a page and unlock three-dimensional models, videos, and interactive elements — transforming static printed content into living, exploreable environments.
VR Laboratories simulate scientific experiments, historical environments, and abstract mathematical spaces in ways that dramatically accelerate comprehension and make previously inaccessible content tangible.
Data Visualisation Tools teach students to create as well as interpret visual representations of information — developing the analytical and communication skills that are among the most valued in the 21st-century workplace.
Visual Learning at Ecole Globale: Technology in Service of Understanding

At Ecole Globale International Girls’ School, the power of visual learning is embedded in how the school approaches instruction across every subject.
The school’s science laboratories use Virtual Reality and Augmented Reality technologies to help students visualise concepts that are impossible to observe directly — molecular geometry in chemistry, human anatomy in biology, tectonic movement in geography. Students do not just read about molecular structures; they observe them from within, rotating and exploring them in three dimensions.
AR-enhanced learning materials allow students to unlock additional content, videos, and interactive elements from physical textbooks — bridging the gap between traditional learning and the immersive digital environment that students increasingly inhabit outside school.
Multimedia classrooms enable teachers to integrate video, animation, infographics, and interactive simulations into everyday instruction — delivering the dual-coding benefits of visual-plus-verbal learning in every lesson, not just in dedicated technology sessions.
Collaborative visual projects- including data visualisation assignments, digital presentations, and creative visual communication tasks – develop students’ ability to both consume and create visual knowledge, building the visual literacy that is increasingly essential in professional and public life.
The result is a learning environment where the brain’s natural visual processing power is engaged continuously — and where students develop not just knowledge, but the visual intelligence to navigate an image-rich, data-rich world.
Explore the learning environment at Ecole Globale →
Conclusion: Visual Learning Is Not a Style — It Is a Superpower
The power of visual learning is not confined to students who happen to prefer pictures over text. It is a universal feature of human cognition — available to every brain, in every classroom, at every age.
Schools that harness this power — through thoughtful use of diagrams, video, mind maps, infographics, and immersive technologies — produce students who understand more deeply, retain more reliably, and think more flexibly than those taught through text and lecture alone.
In an era where visual communication — data visualisation, digital media, interactive design — is increasingly central to professional and civic life, the schools that teach students to both use and create visual knowledge are not just improving academic outcomes. They are equipping the next generation with one of the most important literacies of the 21st century.
Begin your Ecole Globale admission enquiry →
Frequently Asked Questions: The Power of Visual Learning
Q1. What is the power of visual learning?
Ans: Visual learning’s power comes from the brain’s architecture: humans process images 60,000 times faster than text, the visual cortex is the largest sensory processing region in the brain, and information presented visually is retained at significantly higher rates than text alone. Visual learning leverages these biological advantages to make education faster, deeper, and more durable.
Q2. Why is visual learning effective for students?
Ans: Visual learning works through dual coding (creating two memory traces — visual and verbal — instead of one), the picture superiority effect (images are retained at 65–80% vs. 10% for text alone), and reduced cognitive load (visual representation frees working memory for understanding rather than decoding). These mechanisms benefit all students, not just those who prefer visual information.
Q3. What are the best visual learning strategies for students?
Ans: The most evidence-backed visual learning strategies include graphic organisers (Venn diagrams, concept maps, flow charts), mind mapping for revision and planning, educational video and animation, infographics, colour coding and visual hierarchy in notes, timelines for sequential content, and — at the most immersive level — VR and AR for complex spatial and abstract concepts.
Q4. Is “visual learner” a scientifically valid concept?
Ans: The idea of fixed learning style “types” (visual, auditory, kinaesthetic) has been largely debunked by research — studies consistently show that matching teaching style to a student’s stated preference does not improve outcomes. However, this does not mean visual learning is ineffective. It means visual strategies benefit all learners, not just self-identified visual learners, because they leverage universal features of human cognition.
Q5. How does technology enhance visual learning in schools?
Ans: Technology expands visual learning from static diagrams to dynamic, immersive experiences. Interactive whiteboards, AR-enhanced textbooks, VR laboratories, educational videos, and data visualisation tools all extend the reach of visual learning into previously inaccessible territory — making abstract, complex, and invisible content tangible and memorable.
Q6. How much of the brain is devoted to visual processing?
Ans: The visual cortex occupies approximately 30% of the cerebral cortex — the largest allocation of any single sensory system. Compared to 8% for touch and 3% for hearing, the dominance of visual processing in the brain explains why visual information is processed faster, retained longer, and understood more deeply than information in other formats.
Ecole Globale International Girls’ School | Village Horawalla, Near Sahaspur, Dehradun – 248197, Uttarakhand, India www.ecoleglobale.com | +91-9557291888